Take Moodle reporting to a whole new level
Interactive Dashboards allow you to report against your courses, activities, users and then drill down into detailed reports. Moodle Data can then be extracted into excel, pdf or printed. There’s no need to purchase separate software or a plugin, advanced reporting comes standard with Virtual Slate. We are continually adding to our Advanced reports library to simplify the process of analysing your Moodle data.
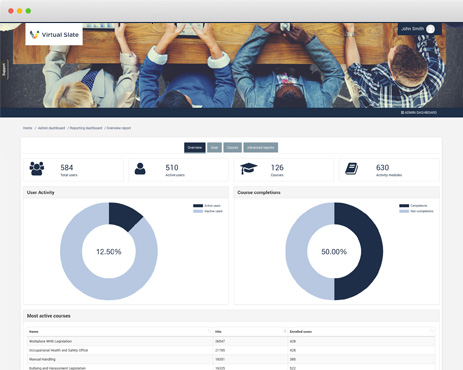
Overview Dashboard
Quickly get a complete picture of your Moodle LMS from a single dashboard. Use the Date Filters to further analyse your Moodle data and drill down into detailed reports. Access interactive charts and filterable data tables from a single screen.
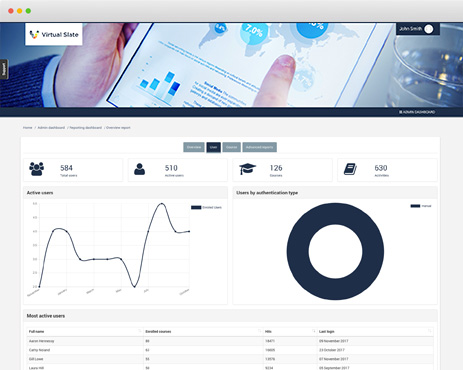
User Dashboard
Learn how your users engage with your Moodle LMS. Better monitor your learners through filterable reports which keep track of user engagement, activity and enrolment. Understand who are your most active and inactive users and then drill down into the data to get a detailed understanding of them.
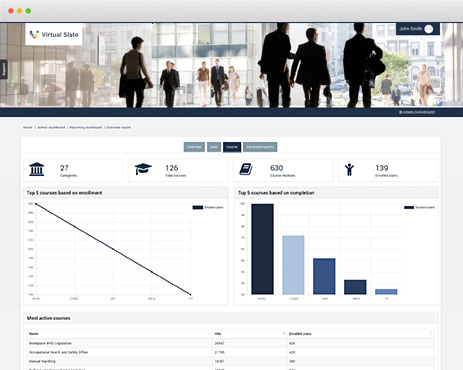
Course Dashboard
Understand how your learners interact with courses in your Moodle LMS and analyse your course data based on enrolment, completion, activity and inactivity. Get to know your top courses based on enrollment and completion. Improve your learner engagement by understanding the courses that they like and don’t like.
Advanced Report
With a growing list of advanced reports, Virtual Slate will help you track and improve your learners engagement. our Advanced reports will give you access to course, grade, scorm, resources and certificate reports. You will also get instant access to any new report we develop and upload into Virtual Slate.

Request a Demo
A Moodle expert is just a phone call or email away


