Analyze your learners performance with Moodle Reporting and Analytics
Course Reports and Activity Completion
Moodle has always allowed Teachers and Administrators to look at Course Reports and Activity Completion to follow learner’s completion on a course. We can see what our users have been doing throughout their course and when they completed each portion.
Out of the box Moodle provides a variety of reports, such as:
Course reports:
- Competency breakdown report
- Logs
- Activity report
- Participation report
- Statistics
- Event monitoring
Activity reports:
- Course activity reports
- Individual activity reports
- Complete Report
Moodle Analytics
With the introduction of Inspire Analytics into Moodle core educators can now support their learners by analyzing their performance. This helps educators go beyond simple descriptive analytics to provide predictions of learner success, and ultimately diagnosis and prescriptions to learners and teachers.
Built in modules include:
- Students at risk of dropping out
- No teaching activity
Moodle can also be easily extended with new custom models, based on reusable targets, indicators, and other components.
Virtual Slate Advanced Reporting
Moodle Administrators have used plugins and third party tools to extend Moodle’s reporting capabilities. Although these tools are great, educators and administrators can lack the skills to take advantage of these tools. To get the most out of Moodle reporting without having to install a third party tools or plugins Lingel Learning has included Advanced Reporting Dashboards directly into Virtual Slate, our custom framework that extends Moodle LMS.

Virtual Slate Advanced Reporting Dashboards
- Overview Dashboard: quickly get a complete picture of your Moodle LMS from a single dashboard. Use the Date Filters to further analyse your Moodle data and drill down into detailed reports. Access interactive charts and filterable data tables from a single screen.
- User Dashboard: learn how your users engage with your Moodle LMS. Better monitor your learners through filterable reports which keep track of user engagement, activity and enrolment. Understand who are your most active and inactive users and then drill down into the data to get a detailed understanding of them.
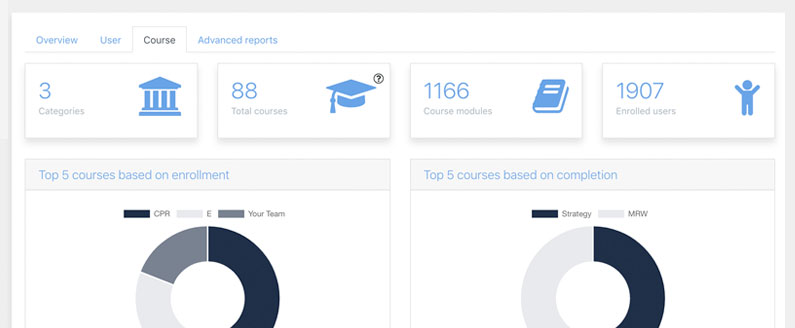
- Course Dashboard: understand how your learners interact with courses in your Moodle LMS and analyse your course data based on enrolment, completion, activity and inactivity. Get to know your top courses based on enrollment and completion. Improve your learner engagement by understanding the courses that they like and don’t like.
- Advanced Reporting: get access to course, grade, scorm, resources and certificate reports. You will also get instant access to any new report we develop and upload into Virtual Slate.
Click here to find out more about Virtual Slate LMS.

Recent Comments