
Many Moodle administrators know there’s a treasure trove of data inside their LMS, but not always how to find it. Whether you’re tracking student engagement, auditing activity, or monitoring course performance, Moodle’s reporting tools can give you the answers you need.
The challenge is knowing which report to use. Moodle offers several types of reports, each serving a different purpose. In this post, we’ll explain the differences between Activity Reports, Logs, and Custom Reports, highlight common issues, and show how to automate reporting for meaningful engagement insights.
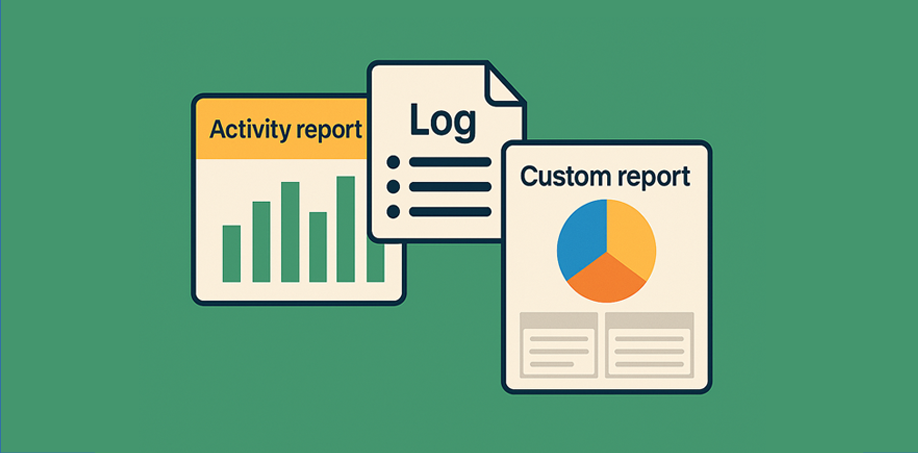
Activity Reports, Logs, and Custom Reports — What’s the Difference?
Activity Reports
Activity reports give a quick snapshot of how often each course activity or resource is viewed. They’re ideal for teachers and course managers who want to see what’s being used, and what’s being ignored.
For example, if a quiz has 80 views but a key reading only 10, it might be time to review that week’s layout or instructions.
Logs
Logs capture every action users take, who did what, when, and where. Each entry includes details such as the user, the activity, the event type, and the timestamp.
They’re the go-to tool when you need detail:
- Checking whether a student submitted an assignment.
- Confirming who accessed a quiz or forum.
- Investigating issues or verifying activity for compliance.
Logs can also be viewed in real time using the Live Logs feature, which displays activity from the past hour.
Custom Reports (Report Builder)
From Moodle 4.0 onwards, administrators and managers can use Custom reports to build powerful, flexible reports directly within Moodle, no external plugins required.
You can combine data from multiple sources (users, courses, activities, completions), add filters, and share results with selected roles. Reports can even include tables and charts for a more visual presentation.
Example use cases:
- Students who haven’t logged in for 14 days.
- Average quiz completion rate by course category.
- Courses with no activity in the last month.
Common Reporting Issues
Even experienced Moodle admins can run into reporting frustrations. Here are a few of the most common pitfalls, and how to fix them.
Missing or incomplete data
- Log retention: Moodle may delete logs after a set period. Check your logstore settings
under Site administration → Plugins → Logging → Standard log. - Completion tracking: If not enabled, some reports will appear empty or incomplete.
- Date and time filters: Reports filtered for the wrong date range or time zone can appear to “lose” data.
Incorrect filters
- Filtering by the wrong role (for example, “student” instead of “participant”).
- Using a date range that’s too narrow.
- Viewing a course-level report when site-level data is needed.
Misinterpretation of results
- High “view” counts don’t always mean meaningful engagement.
- Low activity might be caused by access restrictions or hidden items.
- Combining multiple report types often gives the clearest picture.
Automating Reports
Running reports manually each week can quickly become a chore. Moodle’s Custom Reports feature allows you to schedule regular updates so that key stakeholders always have the latest data.
- Scheduled Reports: Set up regular deliveries for managers or course leaders.
- CSV or Excel exports: All report types can be exported for further analysis or sharing.
- Integrations: Export reports to external analytics tools for dashboards or visualisation.
When automating reports:
- Schedule them during off-peak hours to reduce server load.
- Keep distribution lists focused, too many reports can dilute their impact.
- Review them periodically to ensure they still serve their purpose.
Using Data for Engagement Insights
Reporting is only useful when it leads to action. Here’s how to use Moodle data to improve engagement:
- Spot disengaged learners: Identify students who haven’t logged in or viewed required resources.
- Review underused content: Activity Reports reveal which materials need reworking or better visibility.
- Track course performance: Combine completion data with access frequency for a more complete picture.
- Encourage early intervention: Regular reports help teachers reach out to inactive students before it’s too late.
The goal is to move beyond data collection to data-driven decision-making that improves learning design and outcomes.
Understanding the differences between Activity Reports, Logs, and Custom Reports helps you make the most of Moodle’s built-in analytics.
- Activity Reports offer quick insights into course participation.
- Logs provide detailed, timestamped activity data.
- Custom Reports bring flexibility, automation, and deeper analysis.
By using these tools together, admins and educators can turn raw data into actionable insight, supporting better engagement, stronger reporting, and continuous improvement across your Moodle site.
Recent Comments